

See sales by hour and by day
Use these reports to plan staff shifts and to see how sales change over time. Both are in the sidebar under Reports, Sale reports.
Sales by hour
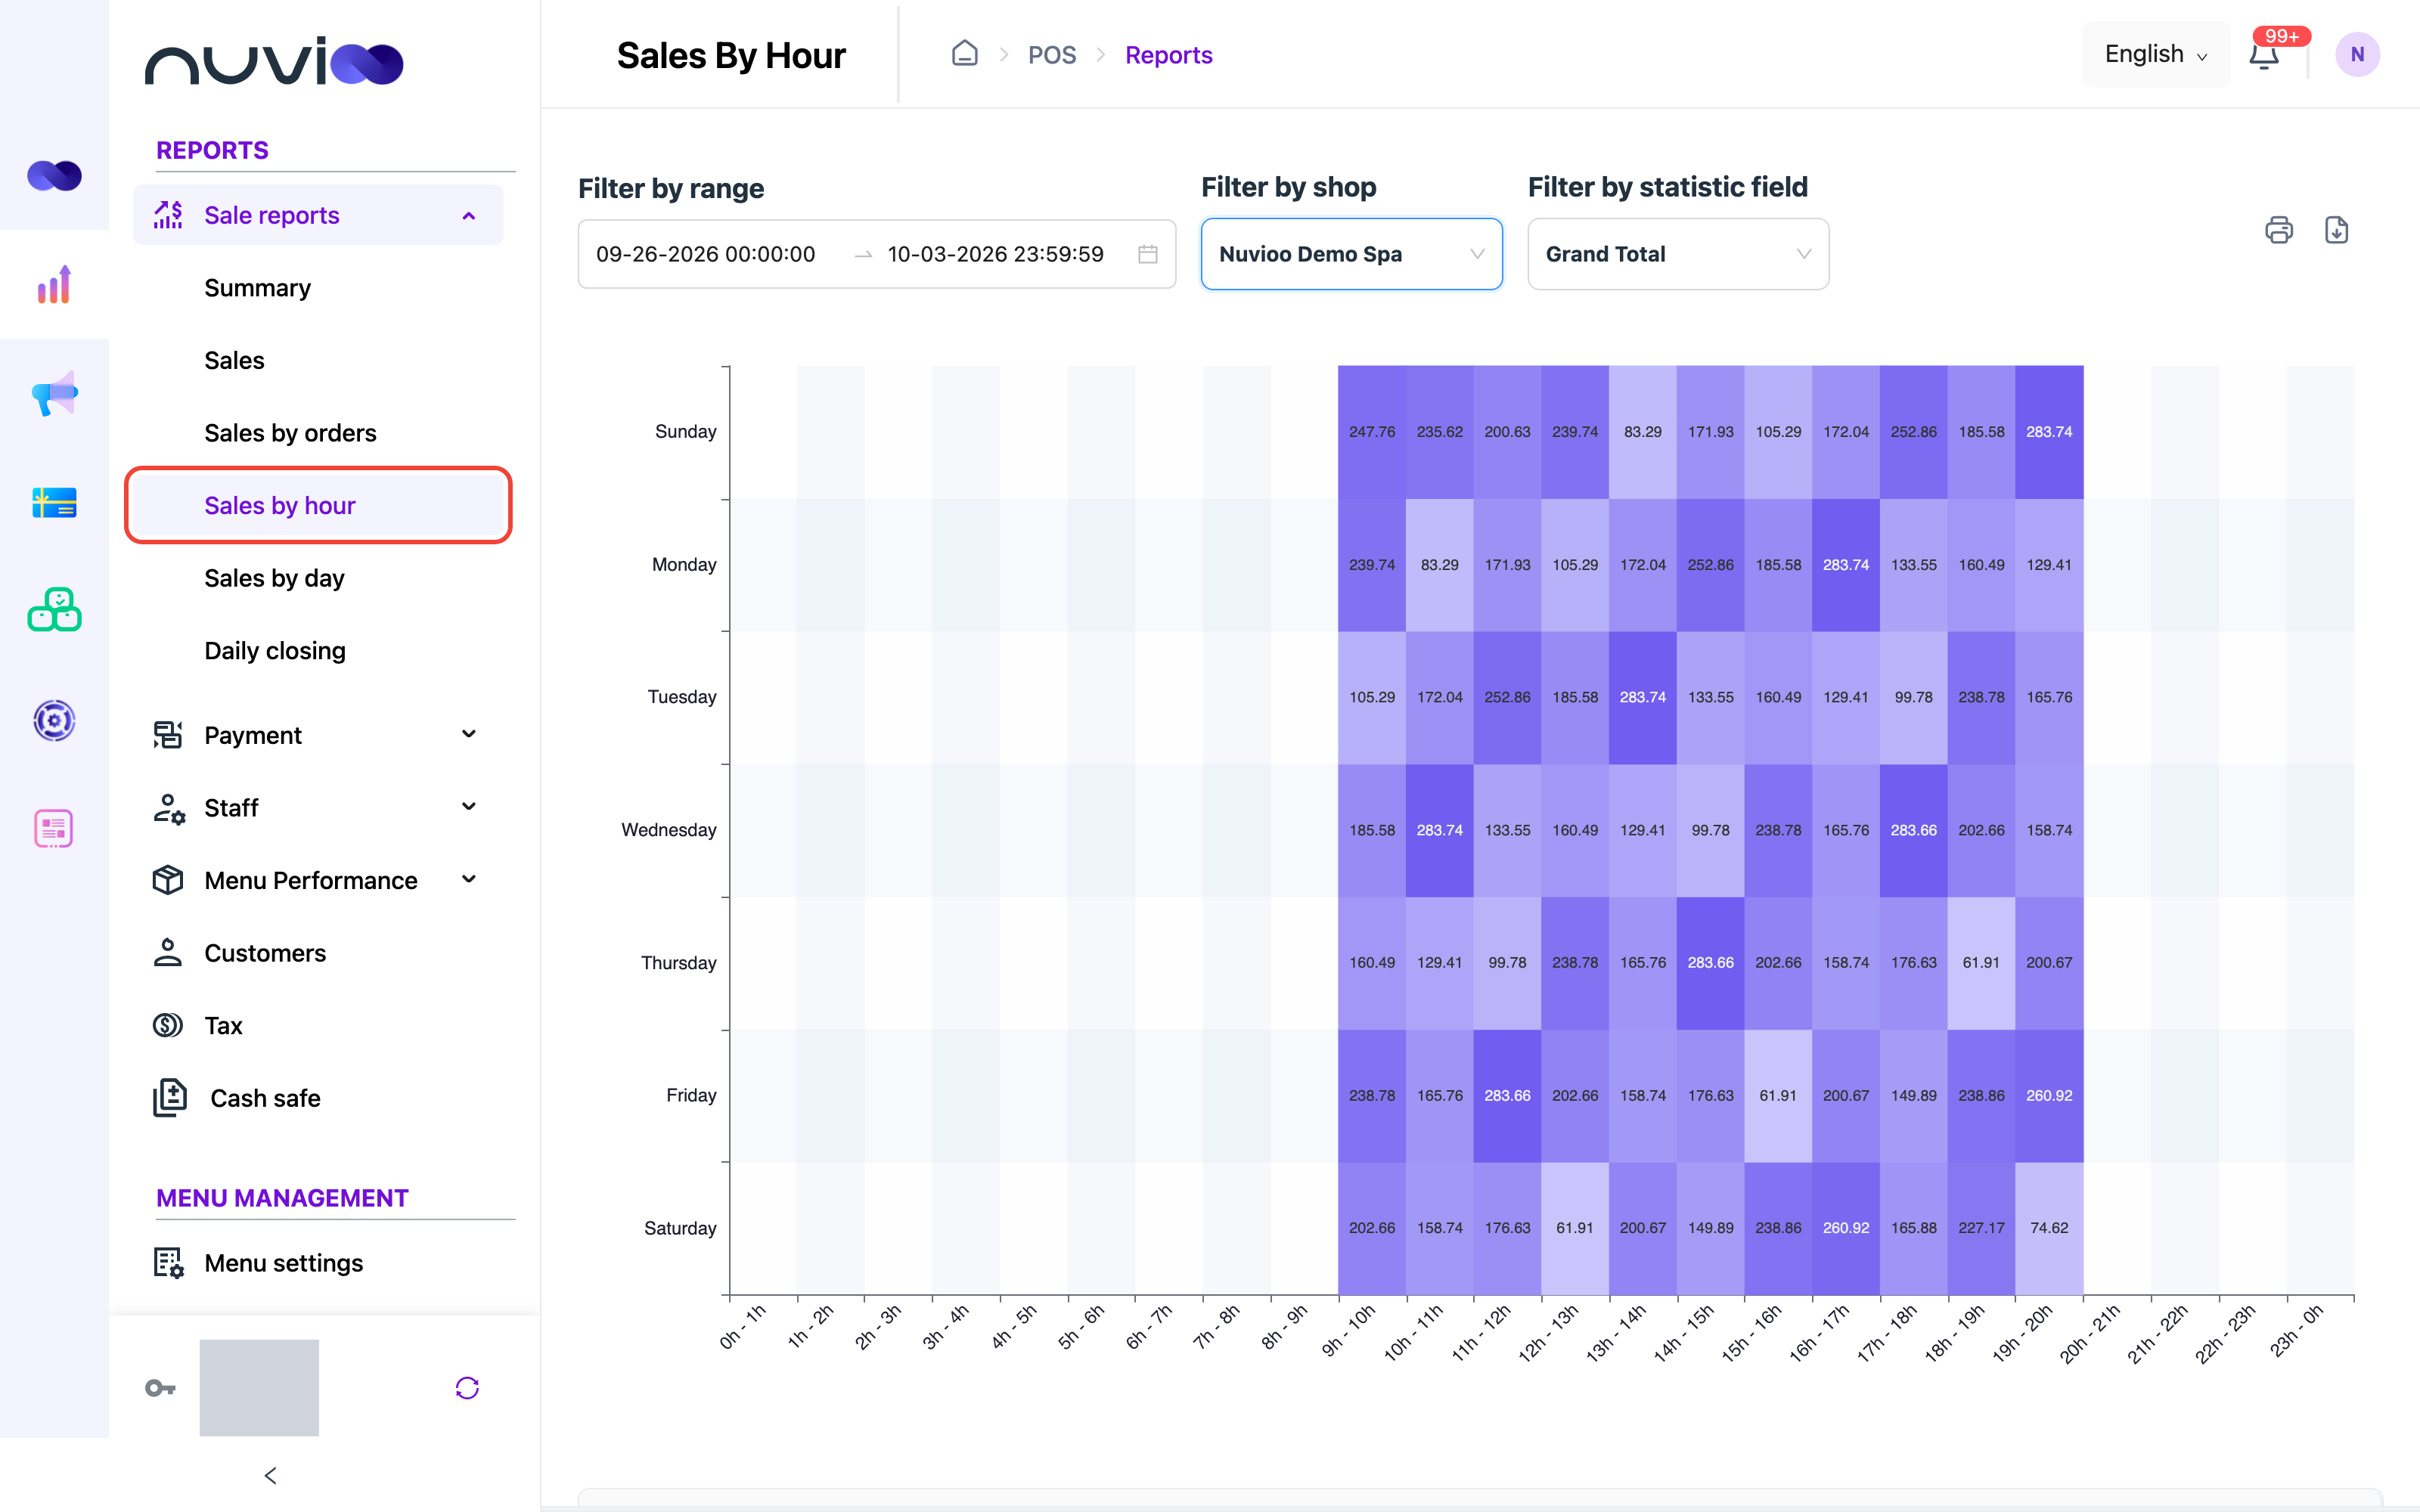
Section titled “Sales by hour”Open Sales by hour. A heat map shows each day of the week against each hour. Darker cells mean more. Below it, a table lists the 24 hours.
Filters
Section titled “Filters”| Filter | What it does |
|---|---|
| Filter by range | The dates and times to include. It opens on the last 7 days through today. You can’t pick a future date. See Summary and sales for the presets. |
| Filter by shop | The location. One at a time. |
| Filter by statistic field | The value that colors the heat map and fills its cells. Grand Total is the default. The other choice is Tip. |
Hours follow your browser’s time zone. Each cell adds up the same weekday and hour across the whole range. For example, every Monday between 9 and 10.
Heat map
Section titled “Heat map”- The horizontal axis shows hours, for example 9h - 10h. The vertical axis shows the days of the week.
- On a wide screen each cell shows its value.
- Point to a cell to see the value and Order count.
- A dash means nothing was sold in that hour.
| Column | What it counts |
|---|---|
| Hour range | The hour, for example 9h - 10h. |
| Number of orders | Orders completed in that hour. A refund doesn’t add an order. |
| Total extra fee | Extra fees charged in that hour, minus fees refunded. |
| Tip amount | All tips (card, cash, traditional terminal and gift card), minus refunded tips. |
| Grand amount | Sales in that hour with no tips, minus refunds. It uses the same basis as Gross sale on the Sales report. Extra fees are included. |
| Avg order amount | Grand amount divided by Number of orders for that hour. |
| Percentage | The hour’s share of the Grand amount for the whole range. |
Click a heading with a sort arrow to sort by that column. Hours with no sales still appear, with a dash in Number of orders.
See what sold in an hour
Section titled “See what sold in an hour”Click the i button at the end of a row. The Sales by hour detail drawer lists the items in orders completed in that hour.
| Column | What it counts |
|---|---|
| Item name | The item. |
| Quantity | Units sold, minus refunded units. |
| Sales amount | The item’s line totals for the units not refunded. Line totals include tax and are after discounts. |
| Percentage | The item’s share of the amounts listed in the drawer. |
Items with no units left after refunds are not listed. Only completed orders count here.
Use Print to print the table, or Download to export it to Excel. See Summary and sales for how these buttons work.
Sales by day
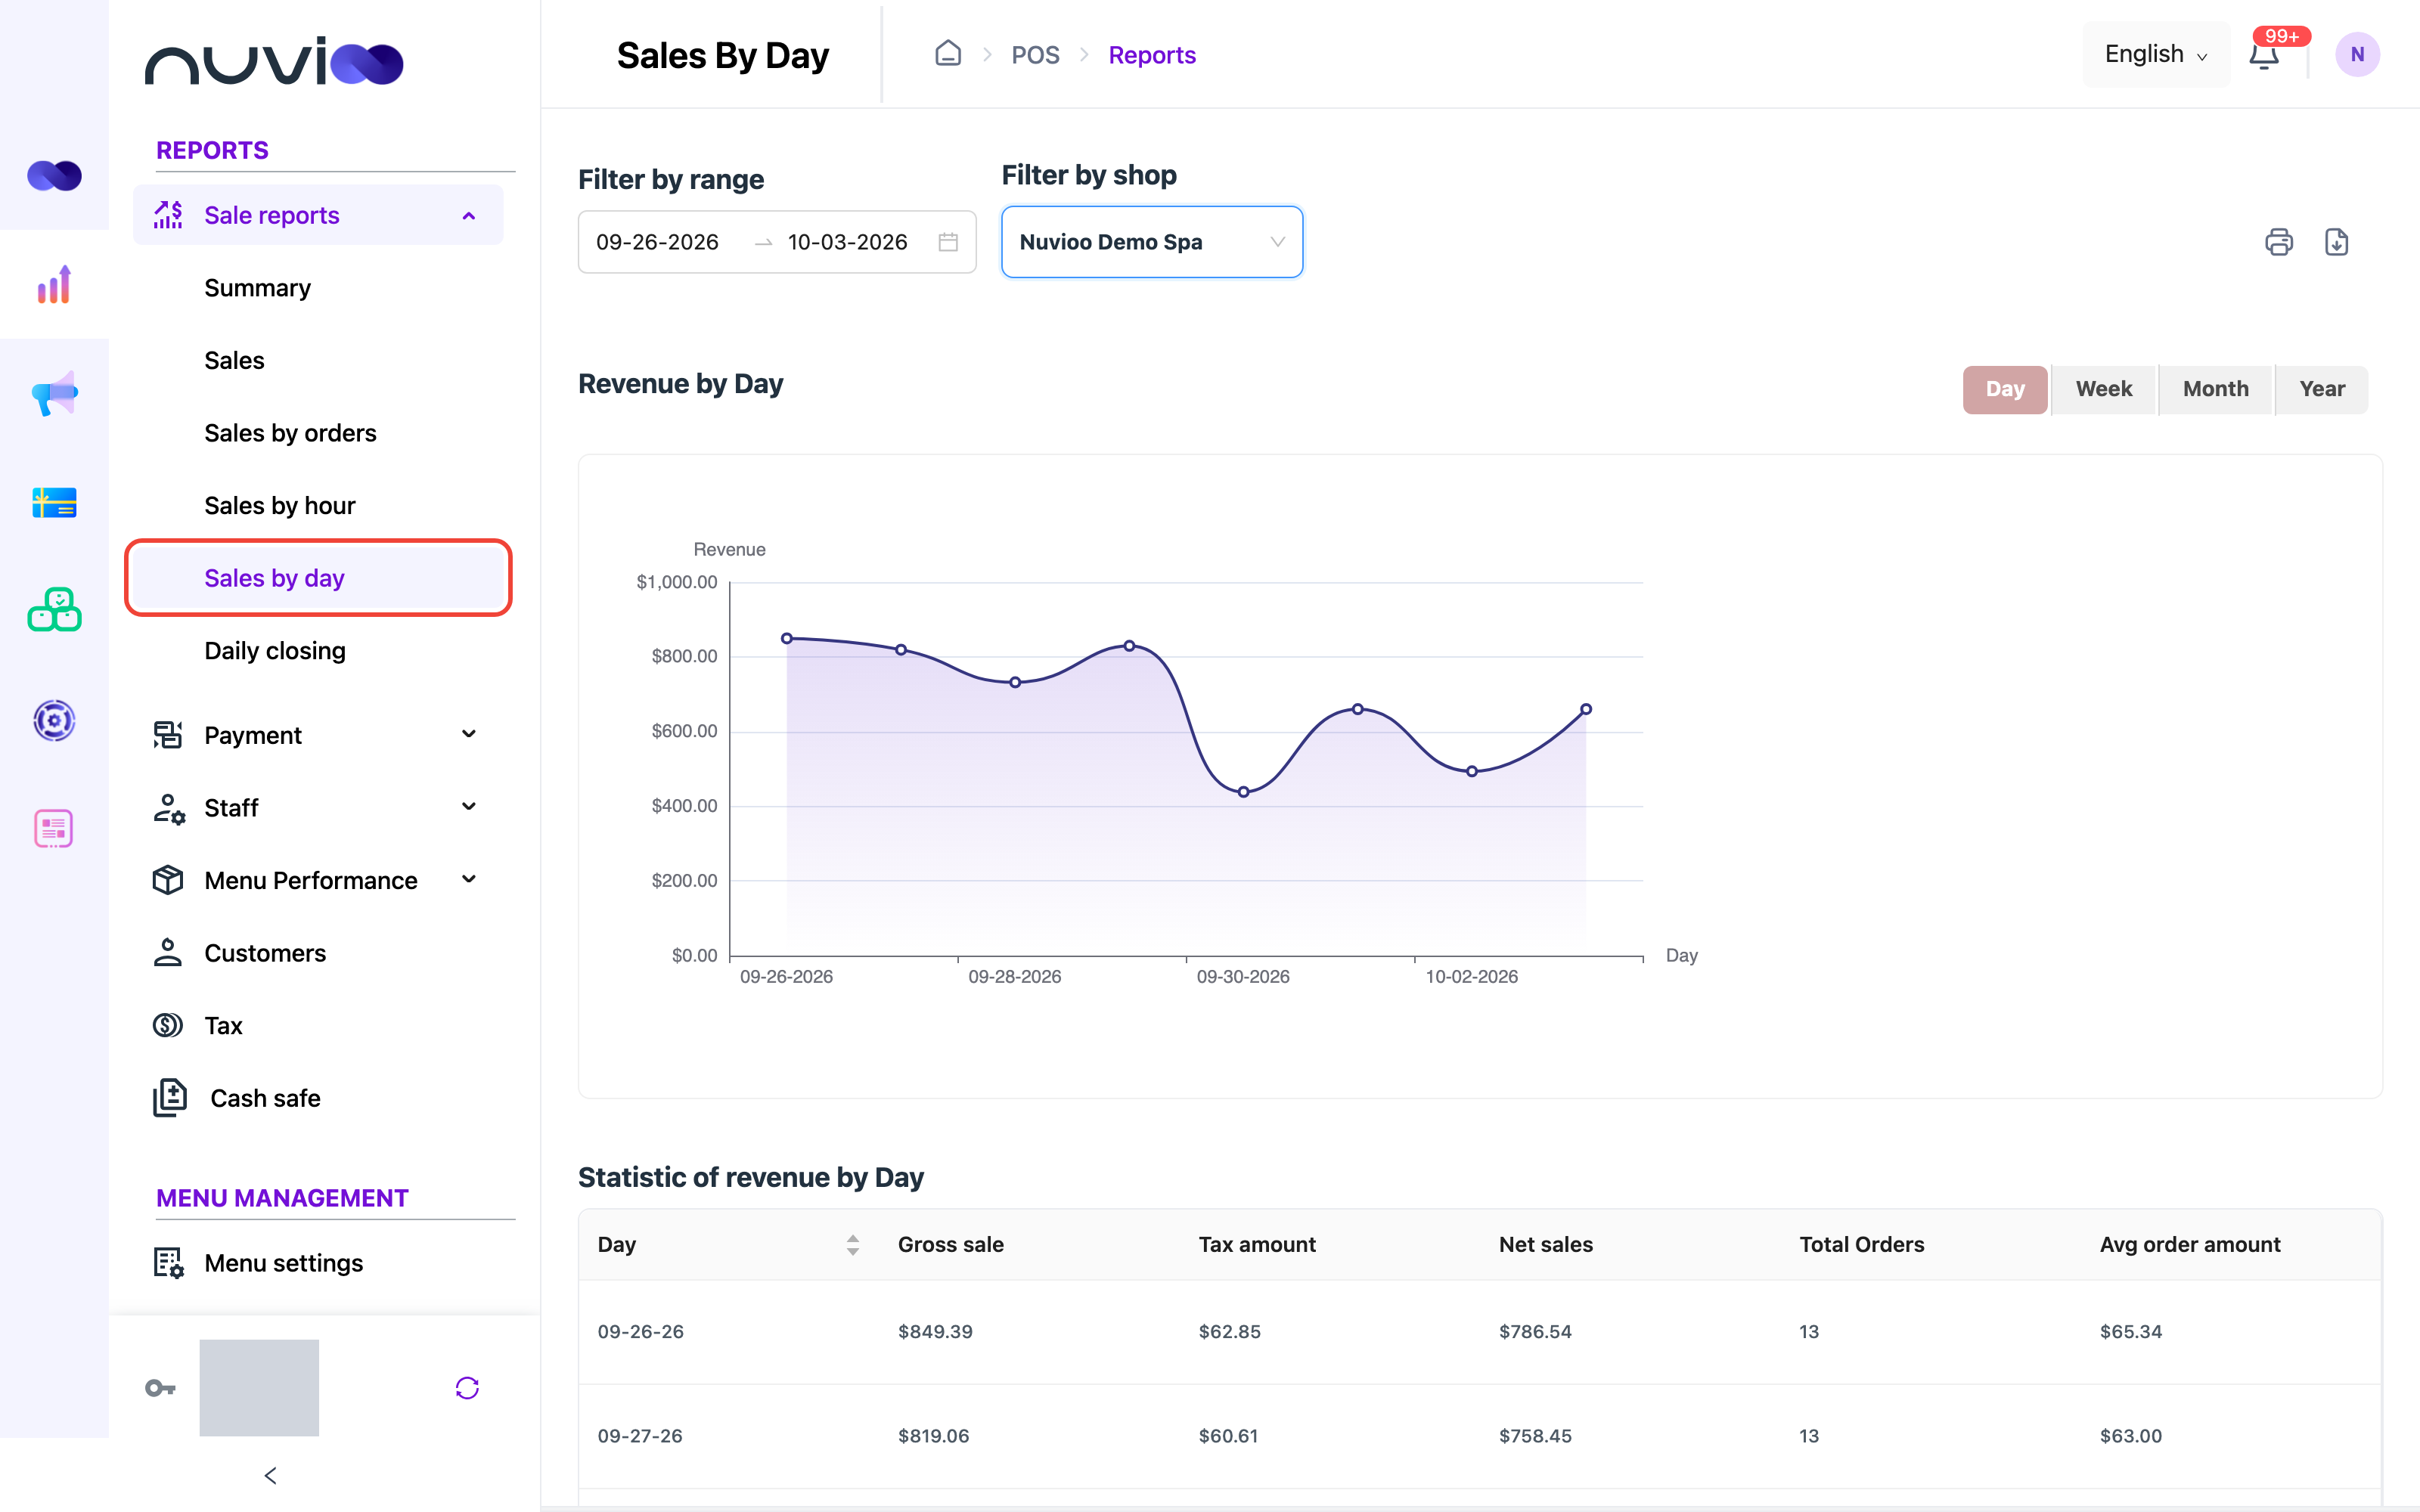
Section titled “Sales by day”Open Sales by day. A line chart shows revenue for each day. A table with the same figures sits below it.
Filters
Section titled “Filters”| Filter | What it does |
|---|---|
| Filter by range | The dates to include. It opens on the last 7 days through today, with your Business hour start and end. You can’t pick a future date. It works as described in Summary and sales. |
| Filter by shop | The location. One at a time. |
| Day, Week, Month, Year | How the days are grouped. Day is the default. The chart title and table title change with it, for example Revenue by Week. |
What counts as one day
Section titled “What counts as one day”A day runs from the start time to the end time of your range. With the default hours, 12:00 AM to 11:59 PM, it is a calendar day.
- If the end time is earlier than the start time, for example 6:00 PM to 2:00 AM, the day ends the next morning. An order completed before the start time counts toward the previous day.
- If the end time is later than the start time, orders completed outside those hours are left out.
- With Week, a label shows the first and last date. With Month you see the month and year. The first and last group are cut to your range.
The chart plots Gross sale for each group. The vertical axis is Revenue. Point to the line to see the value. If nothing matches, the chart shows No data.
The table is titled Statistic of revenue by Day, or by the group you chose. Click the first column heading to sort oldest or newest first. The table opens newest first, ten rows a page.
| Column | What it counts |
|---|---|
| Day (or Week, Month, Year) | The group, shown in your browser’s time zone. |
| Gross sale | Completed order totals minus refunded totals, minus extra fees, tips on extra fees and tips refunded in cash. Tax is included. |
| Tax amount | Tax on completed orders, minus tax on refunds. |
| Net sales | Gross sale − Tax amount + tips refunded in cash. |
| Total Orders | Orders completed or refunded in the group, minus completed orders that were refunded in full in your range. |
| Avg order amount | Gross sale divided by Total Orders. It shows zero when there are no orders. |
Groups with no orders show zero, and a dash in Total Orders.
Use Print to print the table, or Download to export it to Excel. Both follow the grouping you chose.