

See your best-selling items
The Menu Performance reports show what sells and how often discounts are used. In the sidebar, open Reports, then Menu Performance.
Items and categories
Section titled “Items and categories”Open Items & categories. It has two tabs, Categories and Items. Both tabs show the same filters and the same Food Sale and Alcohol Sale cards.
Filters
Section titled “Filters”| Filter | What it does |
|---|---|
| Filter by range | The dates and times to include. It opens on today. Pick a preset (Yesterday up to This year) or your own range. You can’t pick a future date. |
| Filter by shop | The location. One at a time. |
Use Print to print the report, or Download to export it to Excel. See Summary and sales for how these buttons work.
How items are counted
Section titled “How items are counted”- Only completed orders count.
- An order is placed in the range by when it was last updated, not when it was completed.
- Quantity is the units sold minus the units refunded. Amounts are the line totals minus the refunded amounts.
- Line totals include tax and are after discounts.
- Gift cards and items removed from an order are left out.
- Percentage is the row’s share of all item sales in the range, add-ons included.
Categories tab
Section titled “Categories tab”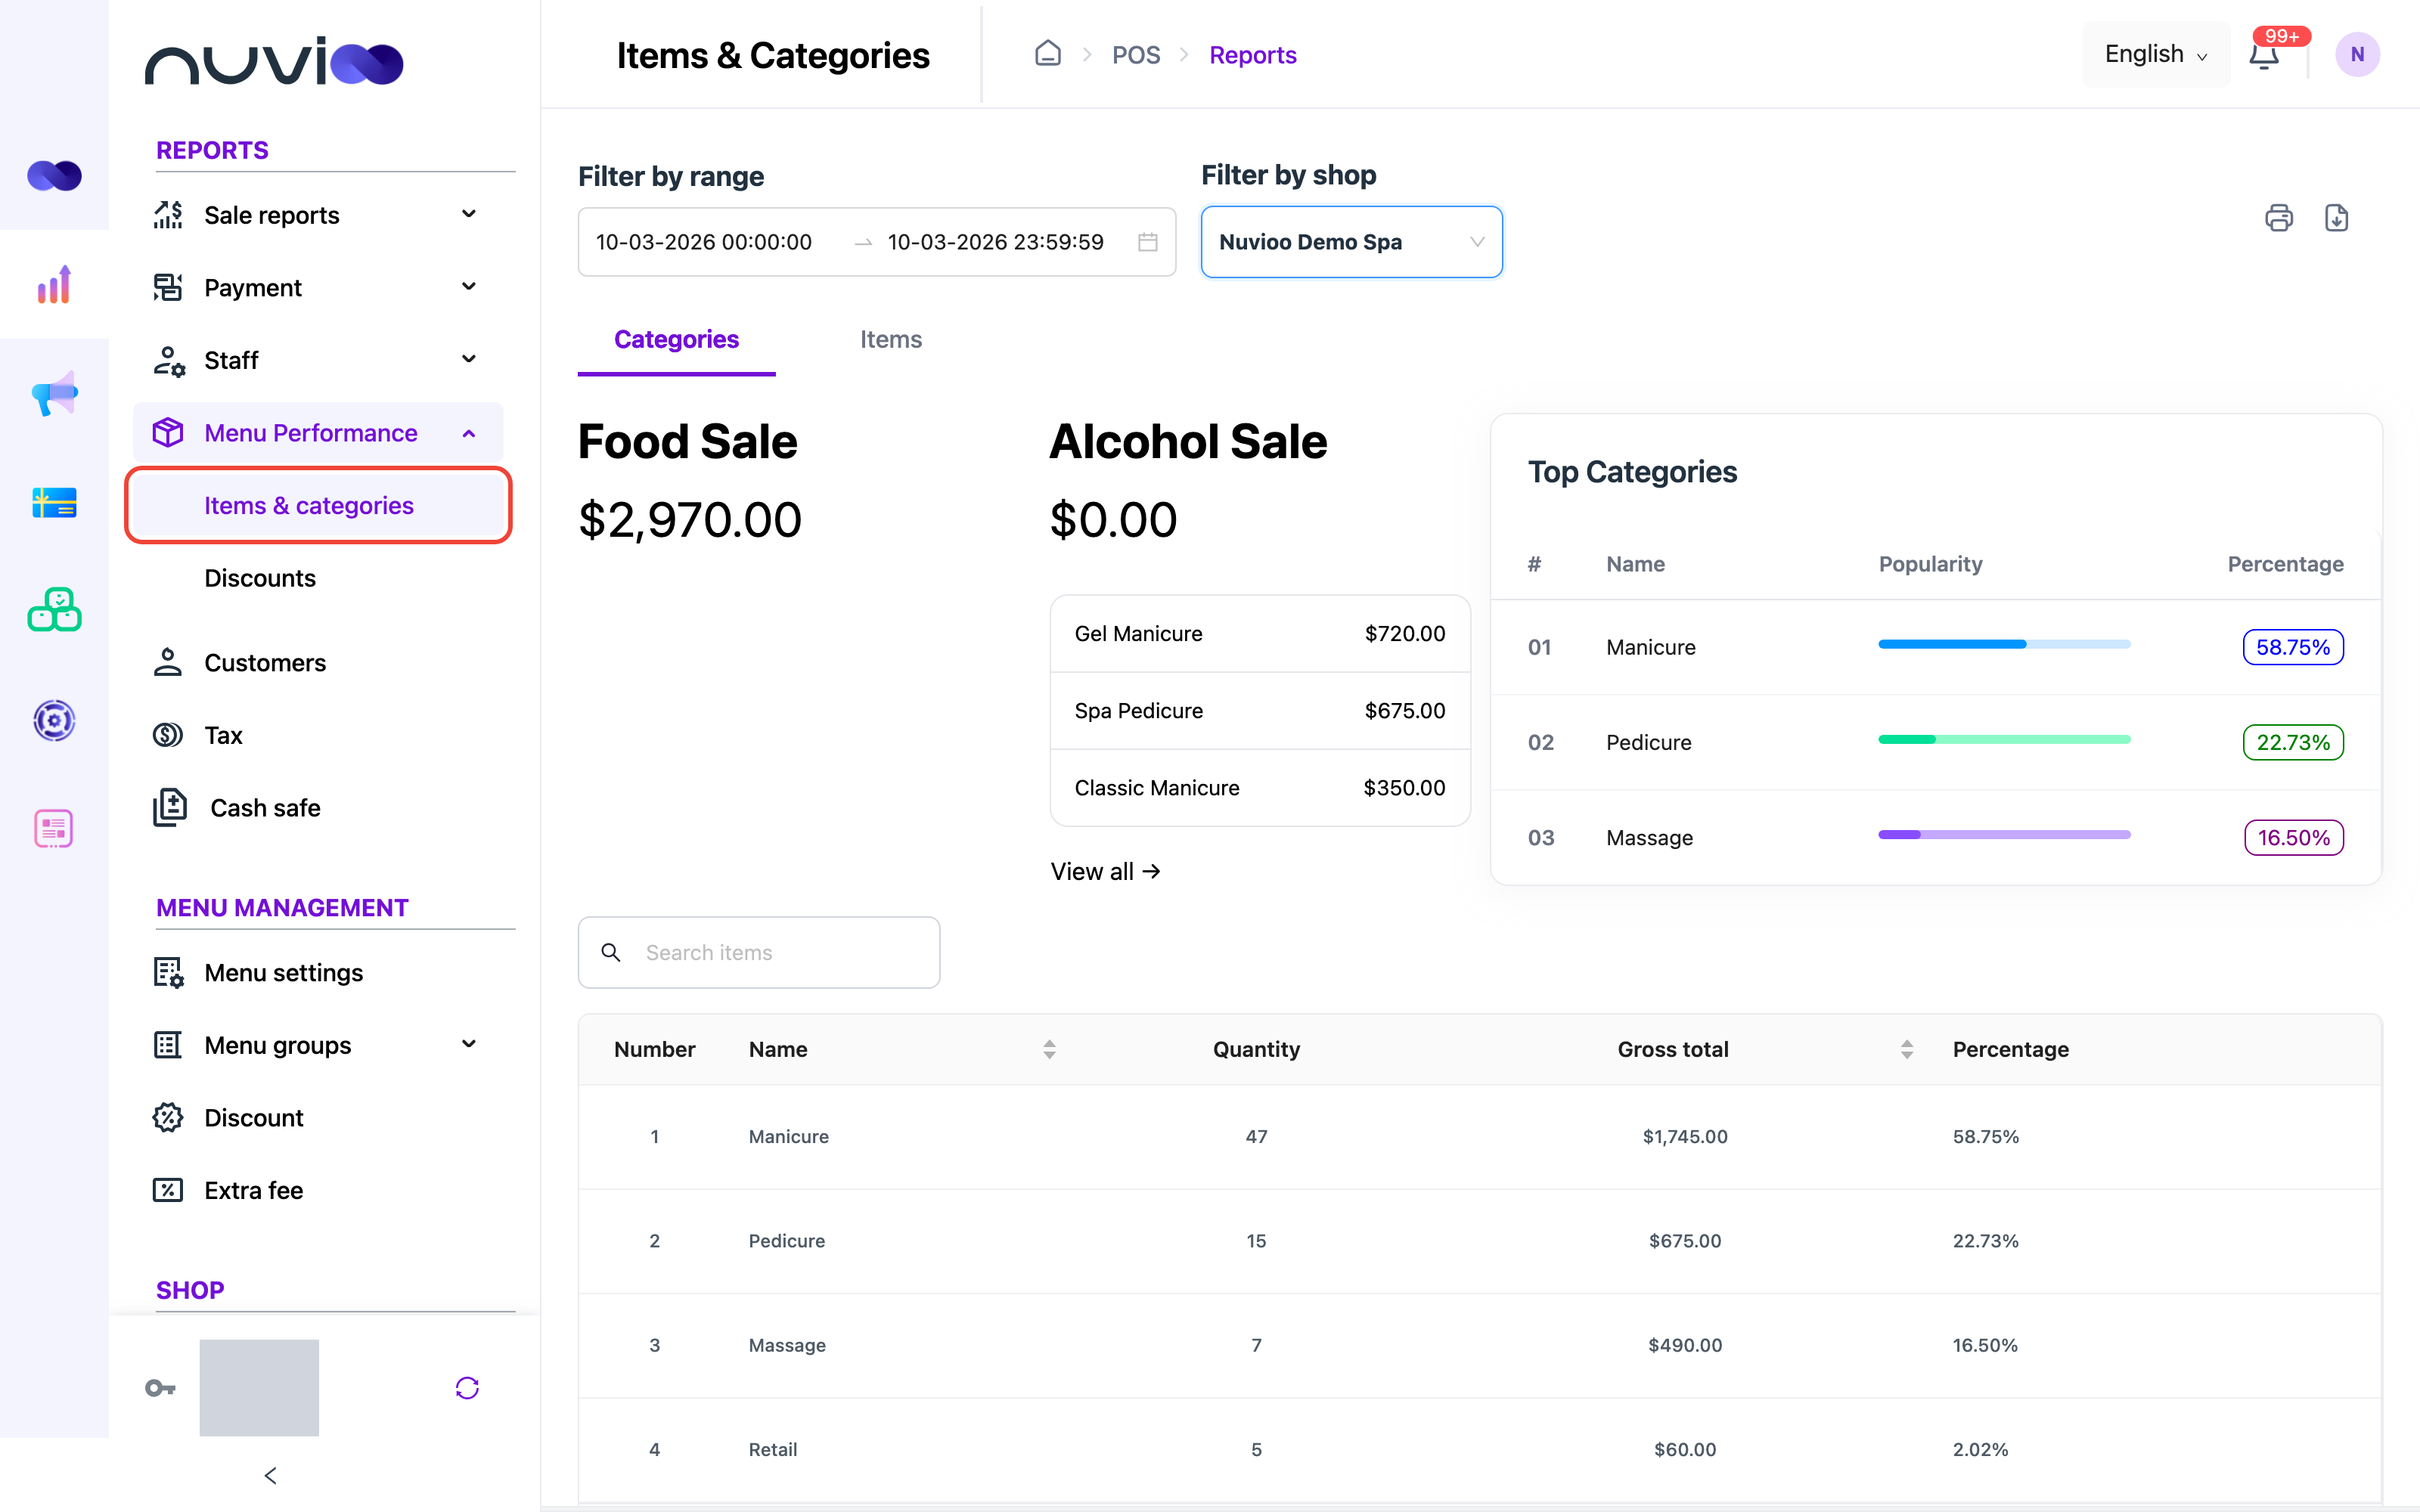
The tab shows three parts.
- Food Sale and Alcohol Sale. See Food and alcohol sales.
- Top Categories: your three categories with the highest Gross total. Each row has a number, the Name, a Popularity bar and a Percentage.
- The categories table. Search by name in Search items.
| Column | What it counts |
|---|---|
| Number | The row number. |
| Name | The category name. Sort it from A to Z or from Z to A. |
| Quantity | Units sold in the category, minus refunded units. |
| Gross total | Sales of items in the category, minus refunds. Sort it from low to high or high to low. |
| Percentage | The category’s share of all item sales. |
Items that aren’t in a category, and categories that only group other categories, are not listed.
Items tab
Section titled “Items tab”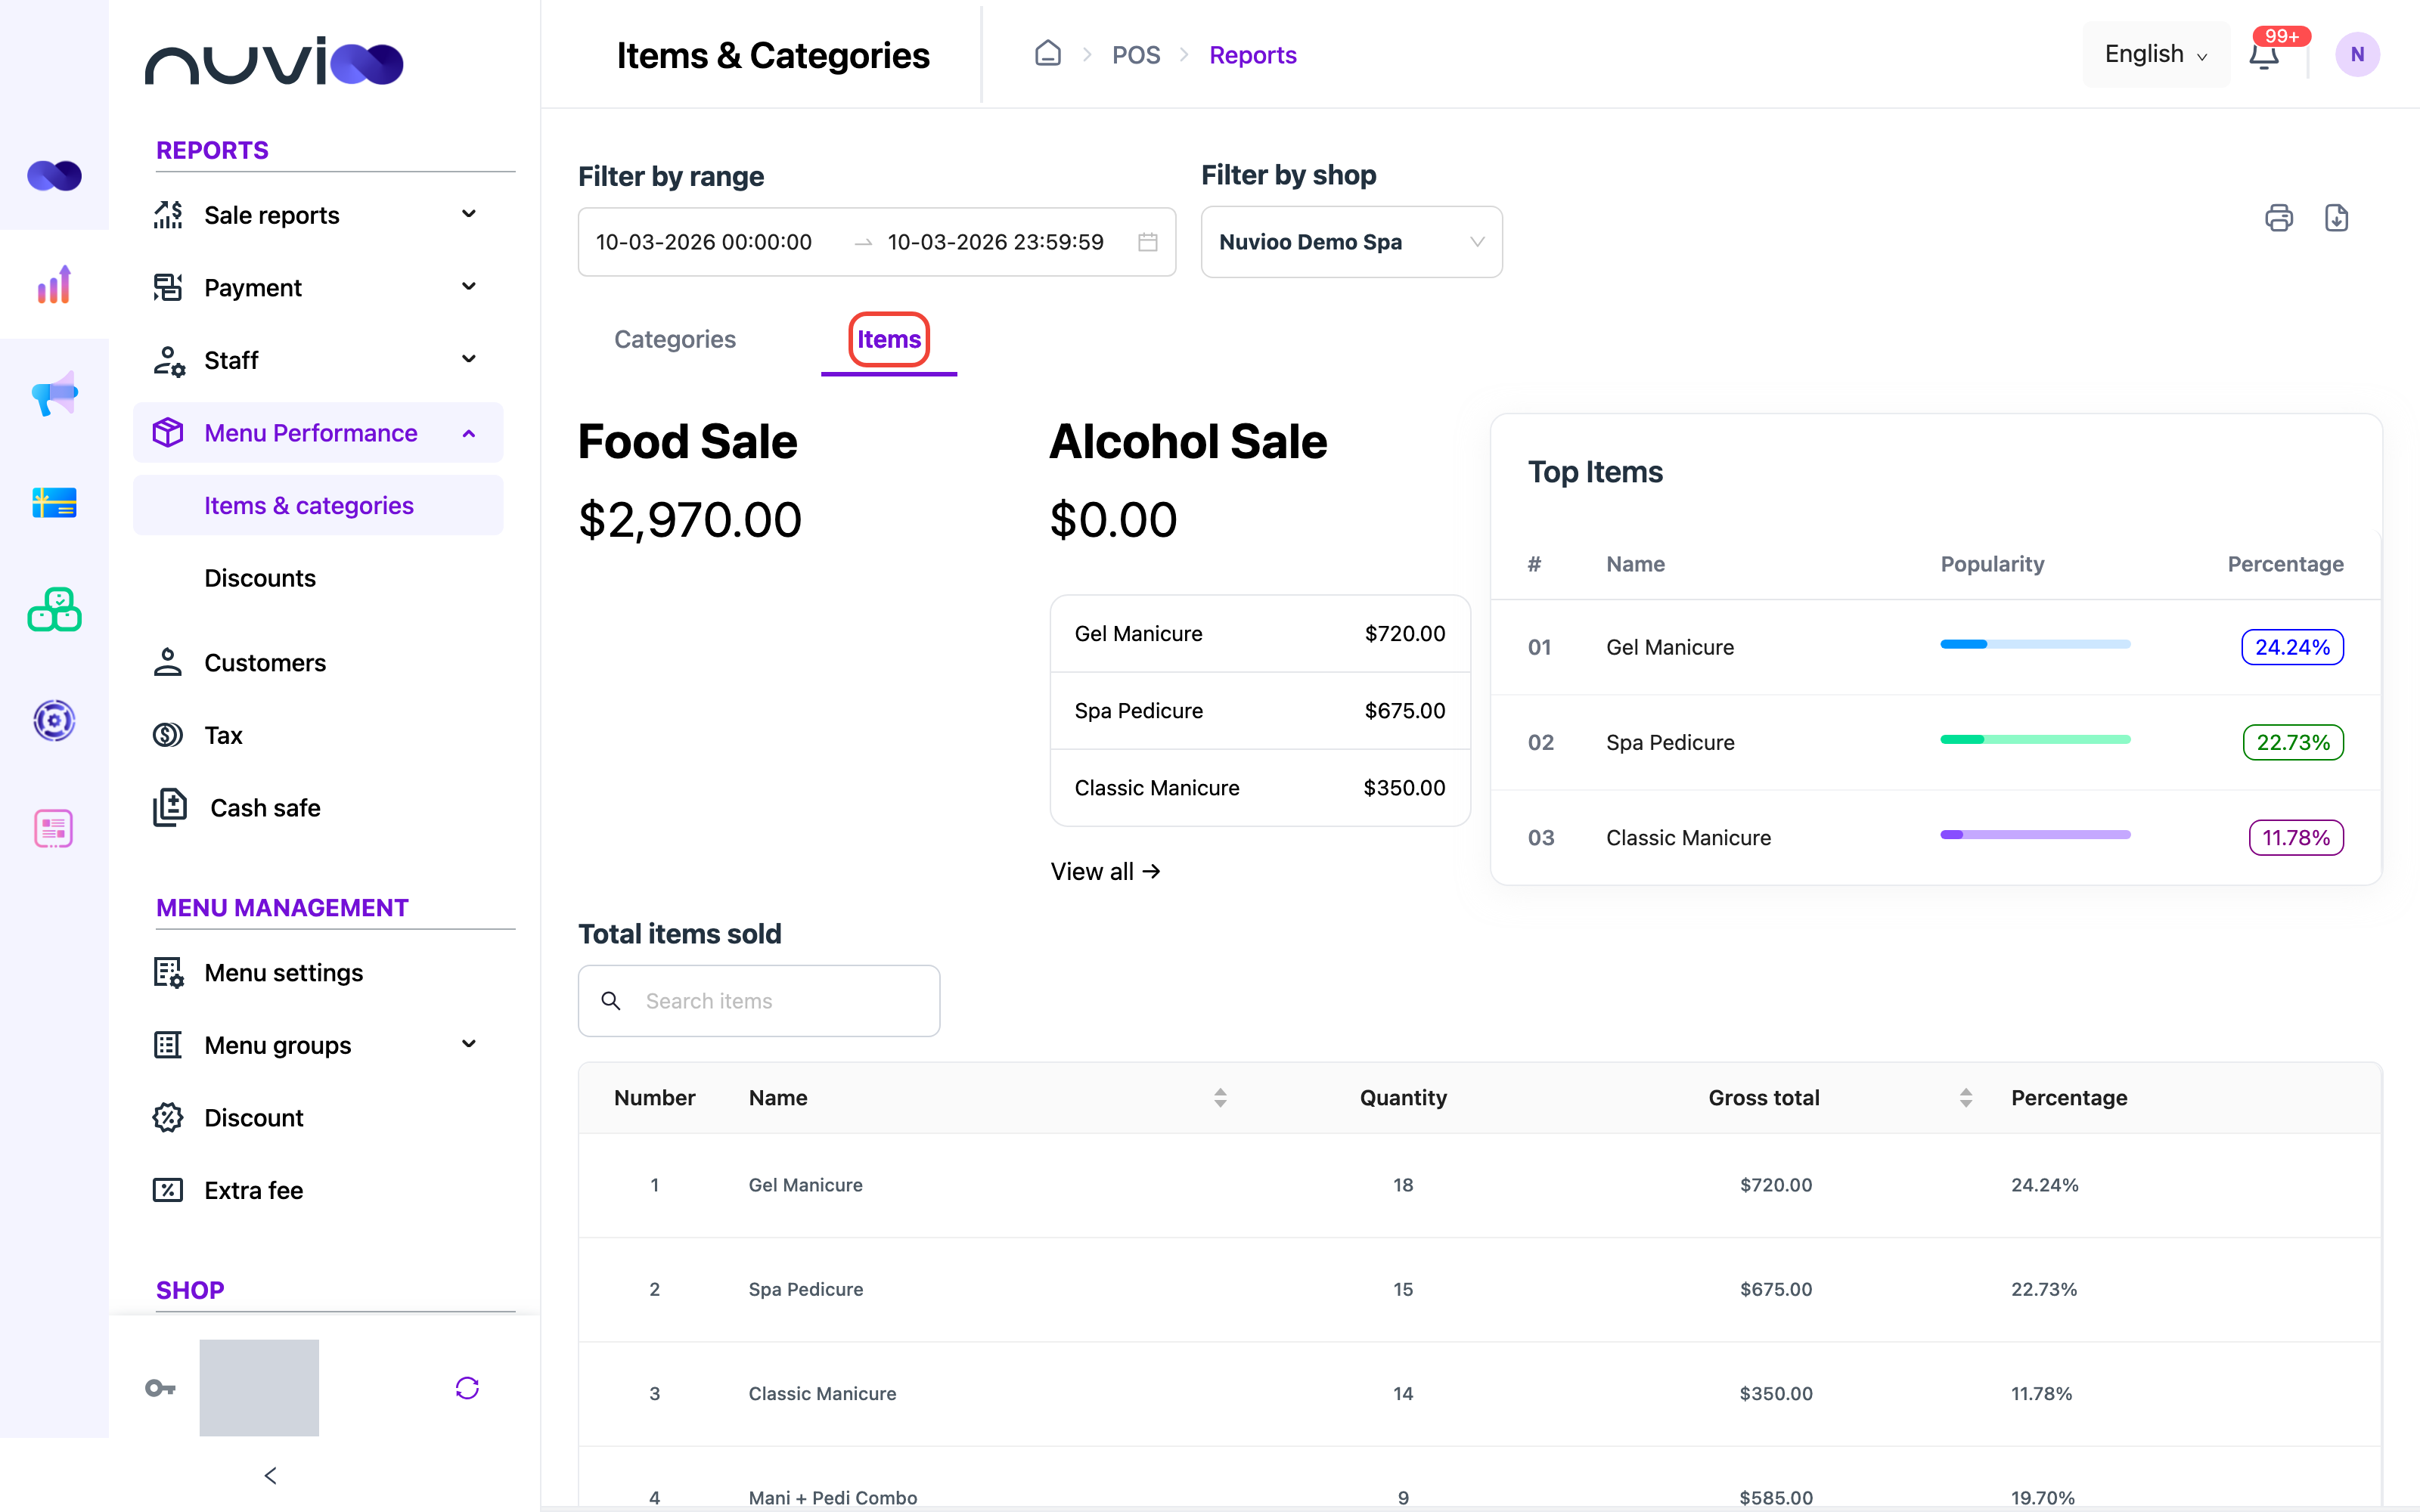
The tab shows Food Sale and Alcohol Sale, then Top Items: your three items with the highest Gross total. Under them are two tables.
Total items sold lists your items. Search by name in Search items. Sort Name or Gross total.
| Column | What it counts |
|---|---|
| Number | The row number. |
| Name | The item name. |
| Quantity | Units sold, minus refunded units. Items with no units left are not listed. |
| Gross total | Sales of the item, minus refunds. Add-ons chosen with the item are not included here. They appear in Total toppings sold. |
| Percentage | The item’s share of all item sales. |
Total toppings sold lists add-ons the same way. Search by name, sort Name or Gross total. Quantity is the add-on quantity times the item quantity, minus refunded units. Gross total is the add-on sales minus refunds.
Food and alcohol sales
Section titled “Food and alcohol sales”Food Sale and Alcohol Sale are the item sales by sale type. They are counted like the cards on the Summary report. An item counts as alcohol when Alcohol Item is ticked on the item. Every other item counts as food. See Items.
If you sold alcohol in the range, the Alcohol Sale card also lists your top three alcohol items with their amounts, and a View all → link.
Open the alcohol list
Click View all →. A page opens with the heading Categories and the Alcohol Sale total. It lists your alcohol items.
Search and sort
Type in Search to find an item. Sort Name, Quantity or Gross total. The columns are the number, Name, Quantity, Gross total and Percentage. The percentage is the item’s share of the alcohol total.
Print or go back
Use Print or Download to keep a copy. Click the back arrow at the top left to return to the report.
There is no list for food sales.
If no orders match, the cards show zero and the tables are empty.
Discounts
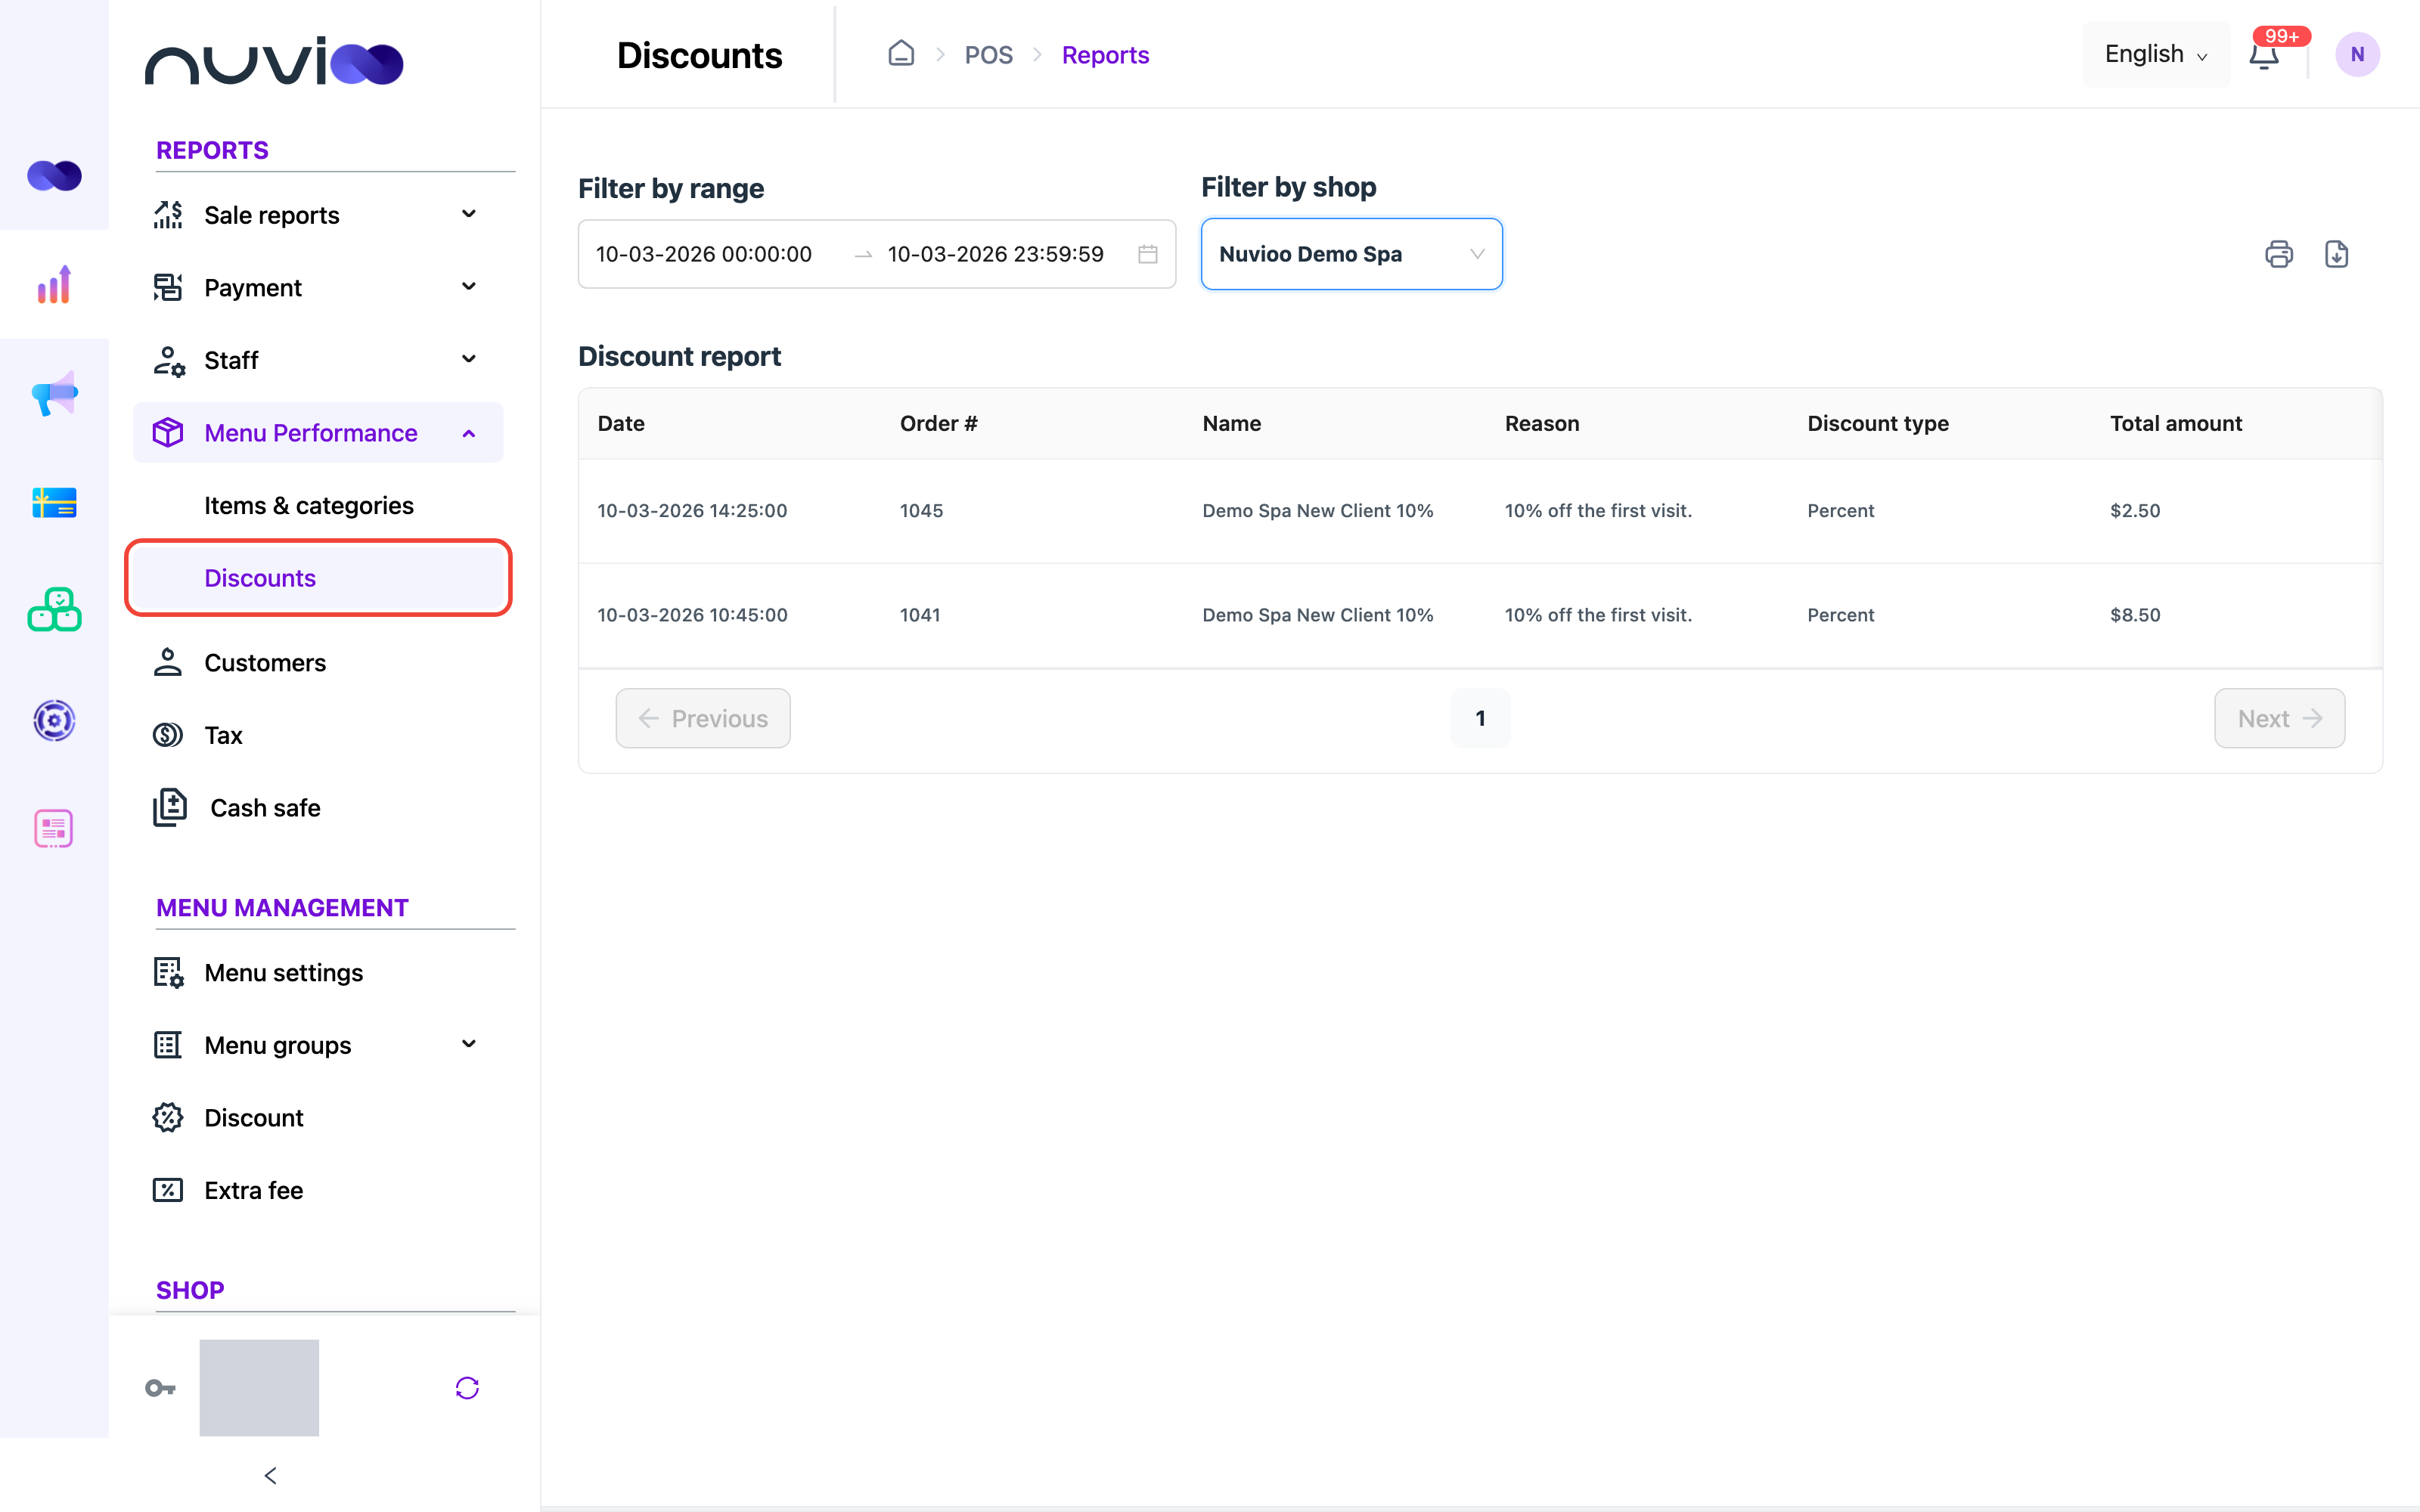
Section titled “Discounts”Open Discounts to see each discount used on an order.
Filters
Section titled “Filters”Filter by range and Filter by shop work as above. The range opens on today. It matches the time each order was created, not completed.
Use Print to print the list, or Download to export it to Excel. The printout starts with the Total amount of every discount listed.
The table is titled Discount report. Every discount on an order has its own row. If one discount applies to several items on an order, those amounts are added into one row.
| Column | What it shows |
|---|---|
| Date | When the order was created. |
| Order # | The order number. |
| Name | The discount’s name. |
| Reason | The discount’s description. Point to it to read the full text. |
| Discount type | How the discount gives its value: Amount, Percent or Price. |
| Total amount | The amount the discount took off that order. |
- Only completed orders are listed. Refunds are not taken off the amounts.
- The list includes discounts staff apply on the POS.
- When several discounts apply to one order, Nuvioo works out each amount from the discount’s settings, in order of priority. See Discounts.
- The report reads the discount’s current name, reason and value. Editing or deleting a discount changes how past orders appear here. Nuvioo shows a warning when you do either.
If no order used a discount in the range, the table is empty.