

Revenue report
The revenue report shows what you’ve earned from paid invoices and subscriptions, and how it compares with an earlier period.
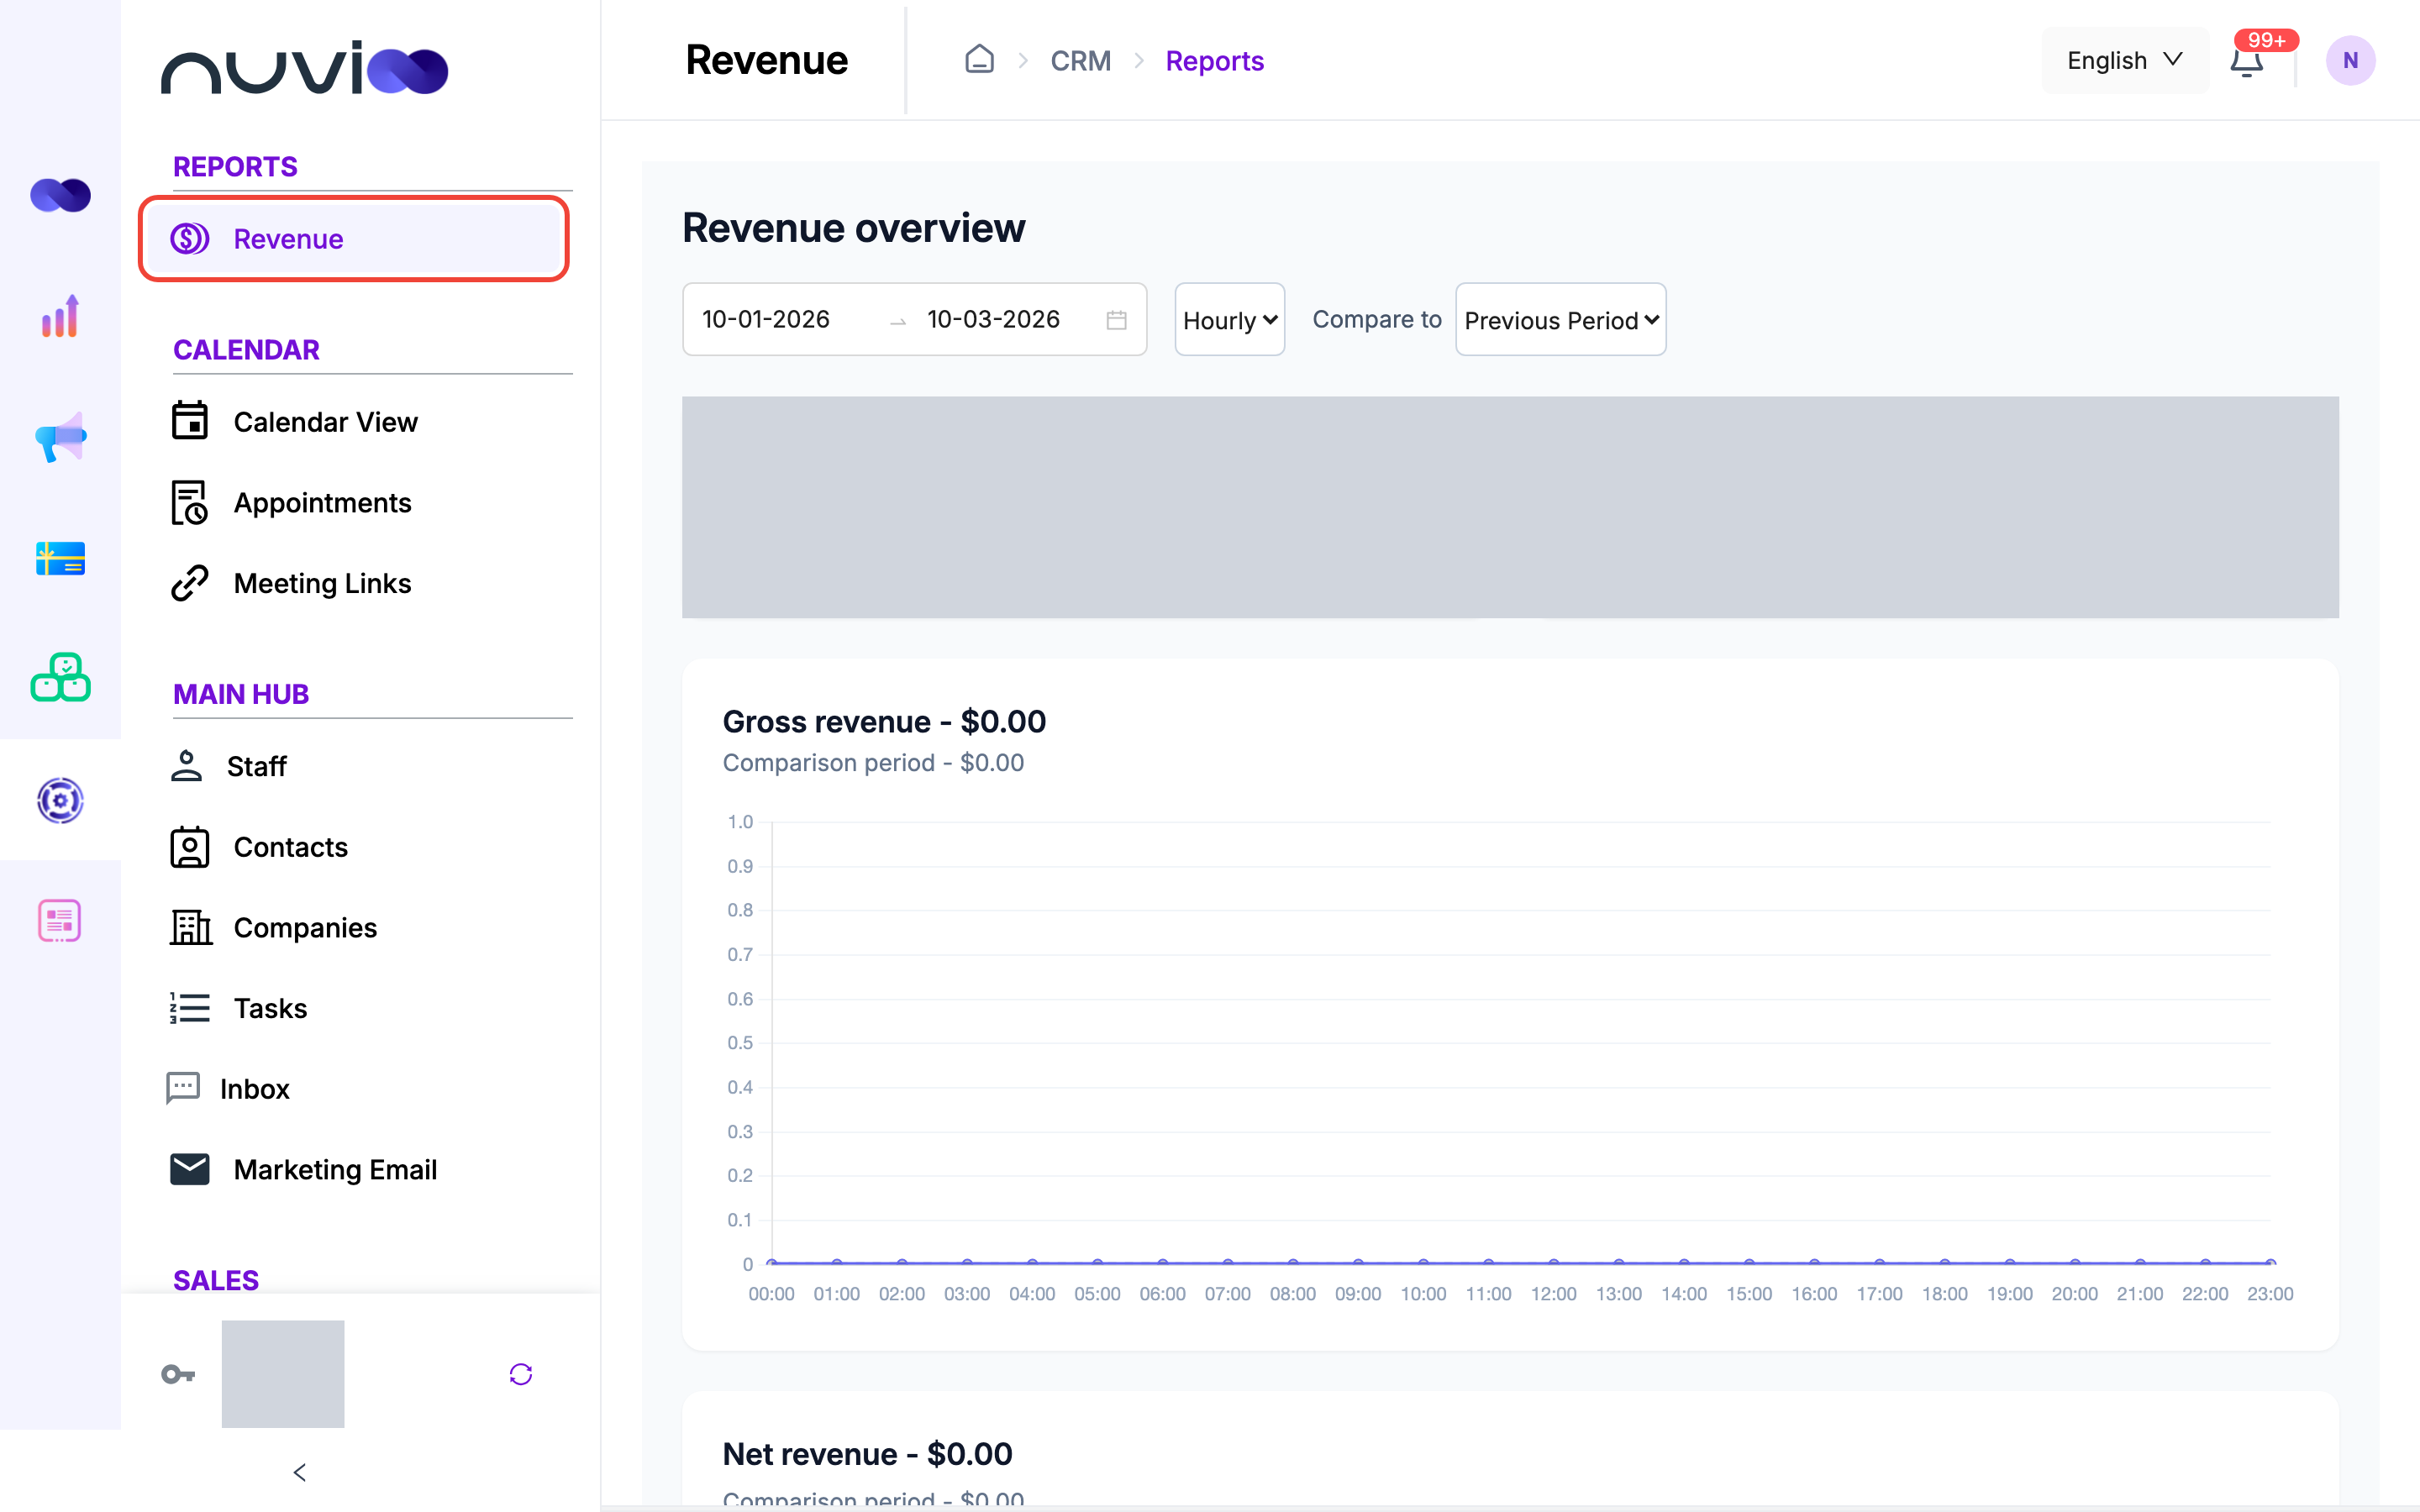
In the sidebar, under Reports, click Revenue. The page is titled Revenue overview.
Filters
Section titled “Filters”Three controls at the top change every chart on the page.
Date range
Section titled “Date range”Pick a start and end date, or choose a shortcut: Today, Last 7 Days, Last 14 Days, Last 30 Days, Last 6 Months, Month to date, Quarter to date or Year to date. The page opens on Month to date. You can’t pick a future date.
Grouping
Section titled “Grouping”The grouping dropdown sets the size of each point on the charts. The choices depend on how long your range is. When you change the range, Nuvioo selects the first choice in the list.
| Range length | Grouping choices |
|---|---|
| Up to 2 days | Hourly |
| 3 to 13 days | Hourly, Daily |
| Exactly 14 days | Hourly, Daily, Weekly |
| More than 14 days, up to 3 months | Daily, Weekly |
| More than 3 months, up to 1 year | Daily, Weekly, Monthly |
| More than 1 year, under 2 years | Weekly, Monthly |
| 2 years or more | Weekly, Monthly, Yearly |
Compare to
Section titled “Compare to”The comparison period is drawn as a dashed grey line next to your range, and its total is shown under each heading.
| Choice | What it compares with |
|---|---|
| Previous Period | The range of the same length right before yours. This is the default. |
| Previous Month | Your range shifted back one month. |
| Previous Year | Your range shifted back one year. |
| Custom | A second date range you pick yourself. |
Previous Month and Previous Year appear only when the shifted range doesn’t overlap your range. For example, a range longer than a month can’t be compared with the previous month.
Metrics
Section titled “Metrics”Hover over a chart point to see its date and value.
Balances
Section titled “Balances”| Metric | What it shows |
|---|---|
| Pending balance | Money from payments that hasn’t settled yet. The note under it reads Available tomorrow. It’s your balance right now and doesn’t depend on the date range. |
| Payout | The net amount of approved payouts in your date range. The note under it reads Available instantly. |
Both come from your Nuvioo Payment Processing account. They show $0 until you set it up under Integrations.
Revenue and payments
Section titled “Revenue and payments”| Metric | What it shows |
|---|---|
| Gross revenue | The total of successful payments in the range, with refunds left out. The heading shows the total, the line under it shows the comparison total, and a badge shows the percentage change when both totals are above zero. |
| Net revenue | The net amount of the same payments, which is what you earn before tax. It has its own chart and comparison total. |
| Payments | The total amount of all payments in the range, as a bar chart by status: Paid, Draft, Failed and Refunded. |
| Successful payments | How many payments went through, with a comparison count. |
| Failed payments | How many payments failed, with a comparison count. |
Customers
Section titled “Customers”| Metric | What it shows |
|---|---|
| New customers | How many contacts were created in the range, with a comparison count. |
| Spend per customer | The average amount paid by each customer who made a successful payment in the range. |
| Top customers by spend | The seven customers who paid the most in the range, with their totals. |
Subscriptions
Section titled “Subscriptions”| Metric | What it shows |
|---|---|
| Active subscriptions | How many subscription billing periods start in the range, with a comparison count. |
| Cancelled subscriptions | How many subscriptions were cancelled in the range, with a comparison count. |